COVID-19’s Association with Parking Violations
COVID-19’s Association with Parking Violations
We recognize that results produced by the ANOVA test confounded by the COVID-19 pandemic, however, as the pandemic has certainly has caused disruptions in many spheres of everyday life. We will investigate whether the daily number of COVID-19 cases over the past year is associated with the number of parking violations.
knitr::opts_chunk$set(
  fig.width = 6,
  fig.asp = .6,
  out.width = "90%"
)

url <- "https://raw.githubusercontent.com/nychealth/coronavirus-data/master/trends/data-by-day.csv"

covid <-
  read_csv(url(url)) %>%
  janitor::clean_names() %>%
  select(date_of_interest, bx_case_count, mn_case_count, si_case_count, qn_case_count, bk_case_count) %>%
  pivot_longer(
    cols = bx_case_count:bk_case_count,
    names_to = "borough",
    values_to = "new_cases"
  ) %>%
  mutate(
    borough_abbr = str_replace(borough, "_case_count", ""),
    borough =
      case_when(
      borough_abbr == "bx" ~ "Bronx",
      borough_abbr == "bk" ~ "Brooklyn",
      borough_abbr == "mn" ~ "Manhattan",
      borough_abbr == "qn" ~ "Queens",
      borough_abbr == "si" ~ "Staten Island"
    ),
    date_of_interest = as.Date(date_of_interest, "%m/%d/%Y")
  )

violation_covid <-
  violation %>%
  count(issue_date, borough) %>%
  rename(total_violations = n) %>%
  left_join(covid, by = c("issue_date" = "date_of_interest", "borough"))  %>%
  filter(!is.na(new_cases))
First, we will construct a scatter plot of new COVID-19 cases against total violations, colored by borough:
violation_covid %>%
  ggplot(aes(x = new_cases, y = total_violations)) +
  geom_point(alpha = 0.15, aes(col = borough)) +
  geom_smooth(se = FALSE, col = "red") +
  labs(
    x = "New COVID-19 Cases",
    y = "Total Violations",
    col = "Borough",
    title = "Total Violations vs. New COVID-19 Cases (2021)",
    caption = "Note: each point represents a single day of observation"
  )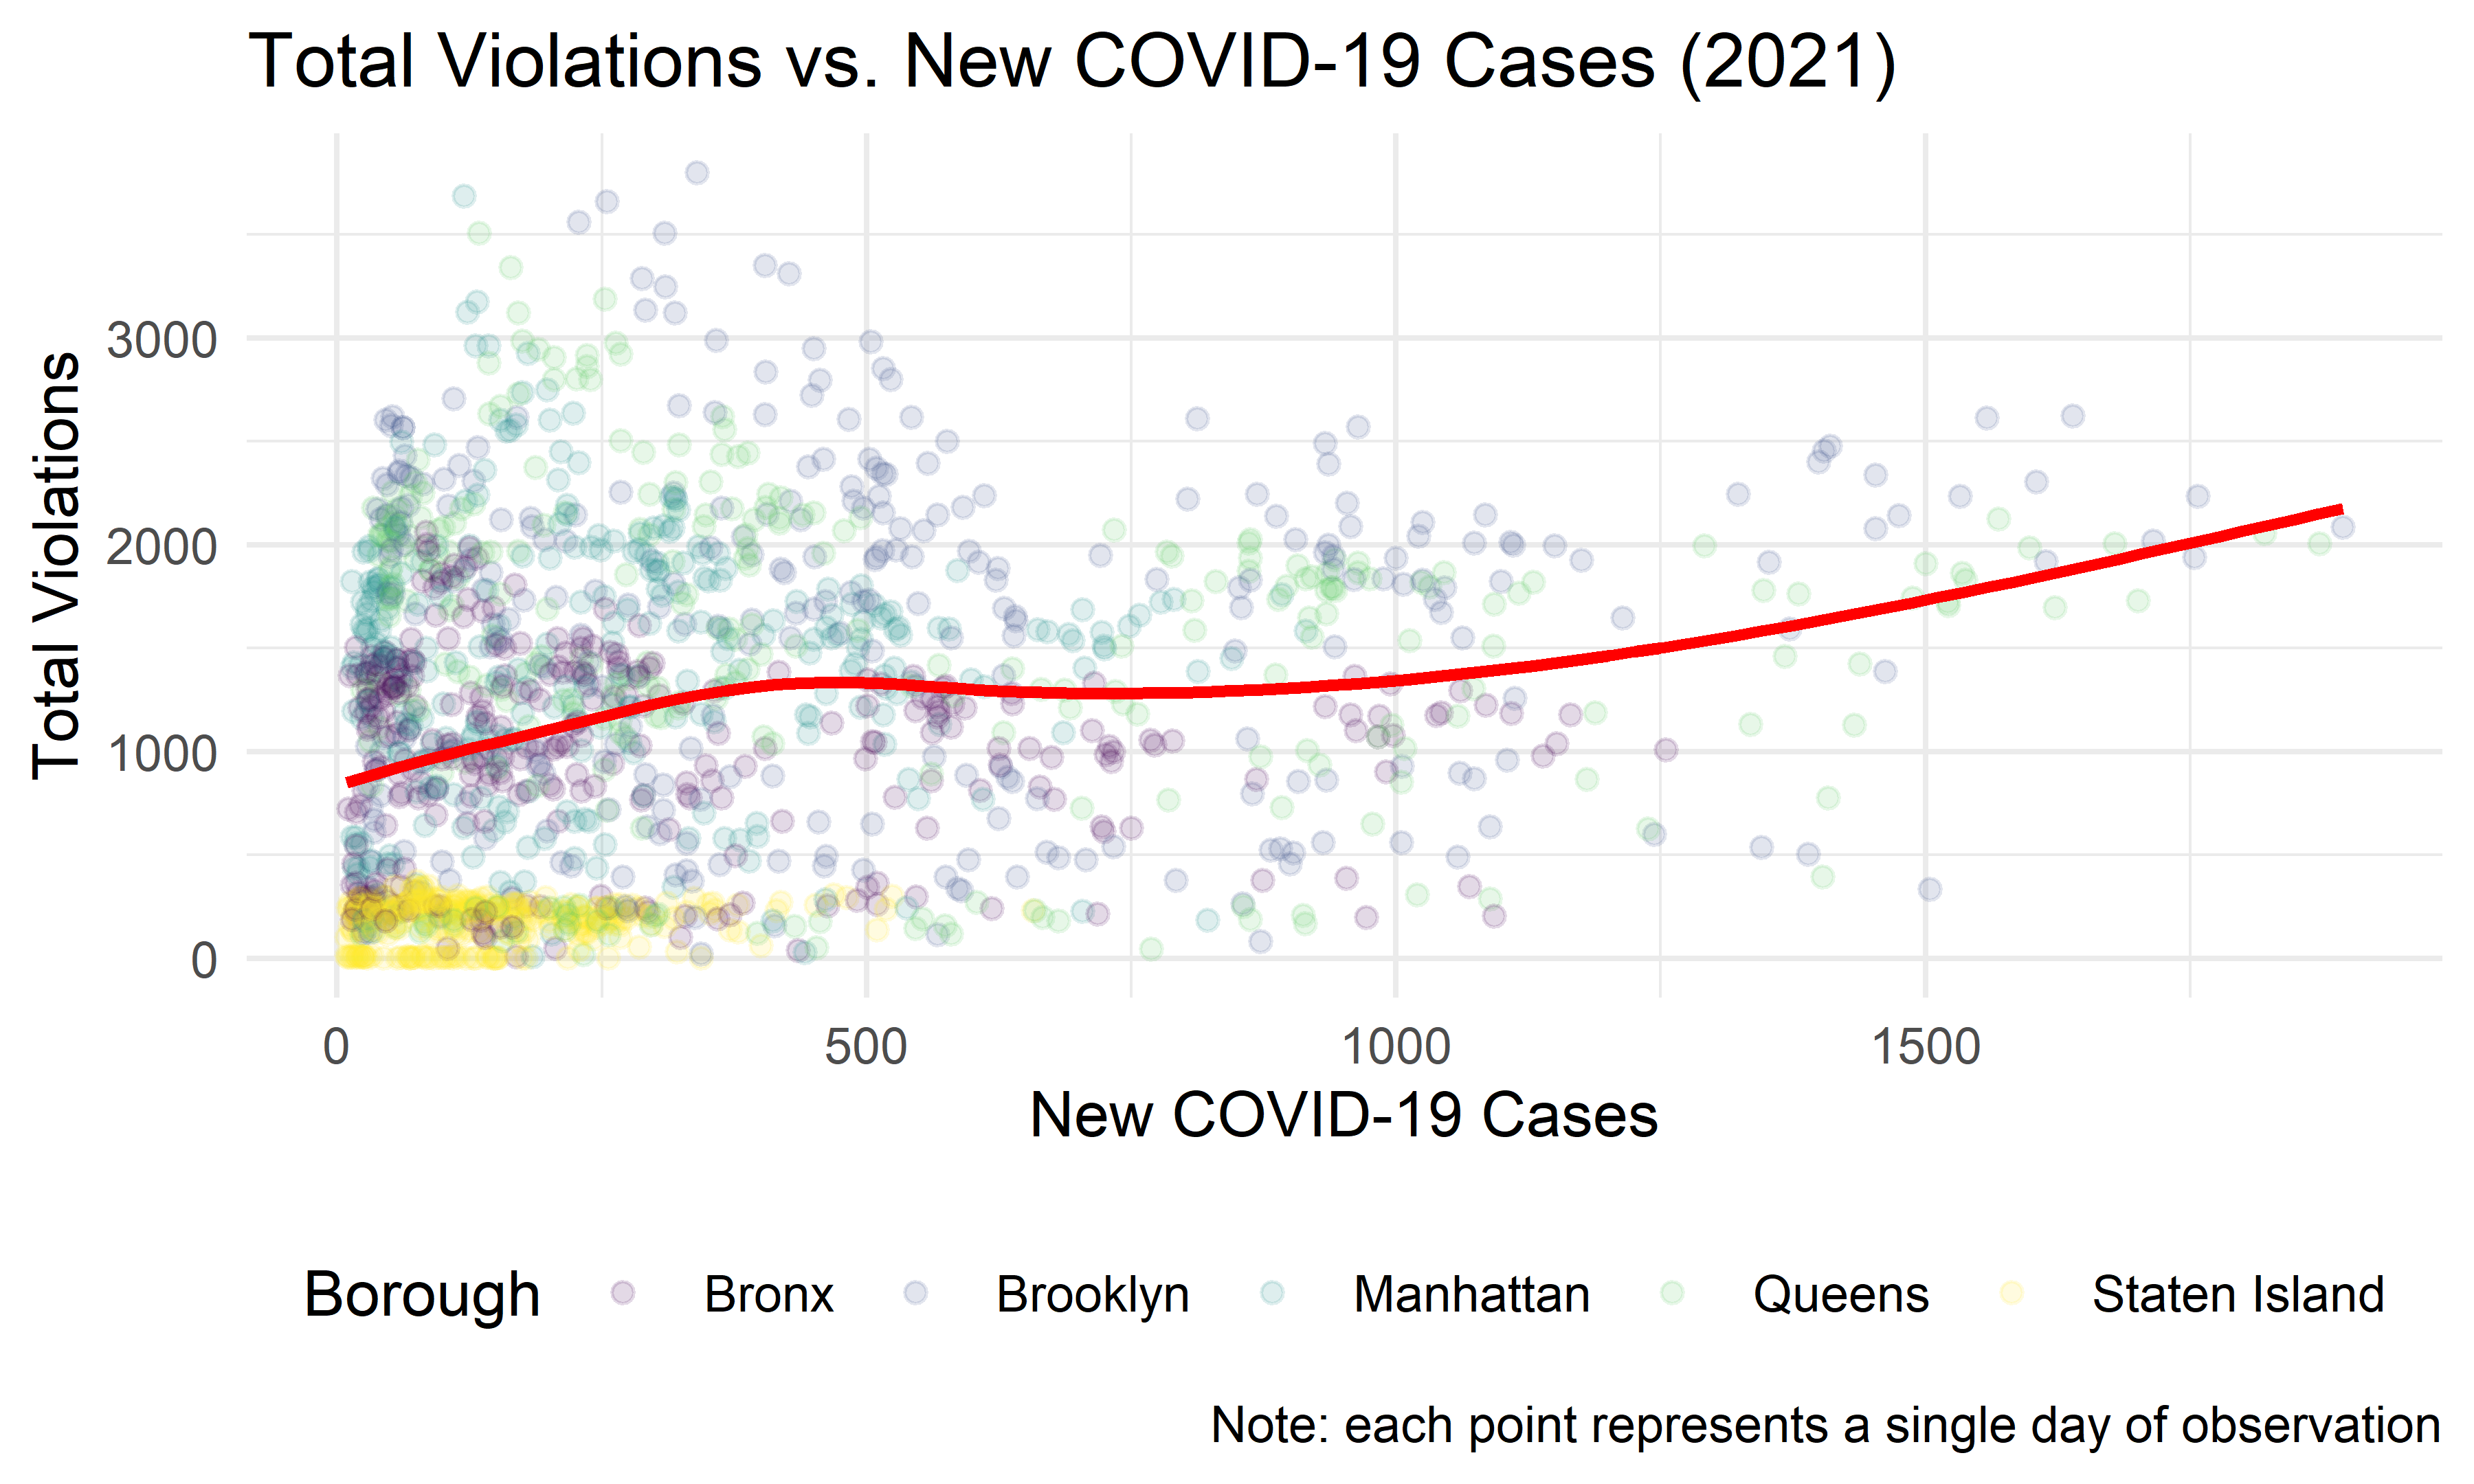
It appears that the greatest range in number of violations given out occurs when there are fewer than about 300 COVID-19 cases a day.
violation_covid_long <-
  violation_covid %>%
  pivot_longer(
    cols = total_violations:new_cases,
    names_to = "parameter",
    values_to = "value"
  ) %>%
  mutate(
    parameter = if_else(parameter == "total_violations", "Total Violations", if_else(parameter == "new_cases", "Total New COVID-19 Cases", ""))
  )

gg_violation_covid <-
  violation_covid_long %>%
  ggplot(aes(x = issue_date, y = value, col = parameter)) +
  geom_line(alpha = 0.2) +
  geom_smooth(se = FALSE) +
  xlim(c(as.Date("01-01-2021", "%m/%d/%Y"), as.Date("11-21-2021", "%m/%d/%Y"))) +
  theme(axis.text.x = element_text(angle = 90, vjust = 0.5, hjust = 1)) +
  labs(
    x = "Date",
    y  = "Count",
    col = "Parameter"
  )

(gg_violation_covid +
    labs(title = "Total Parking Violations and New COVID-19 Cases Over Time\n(2021)") +
    theme(legend.position = "none")) /
(gg_violation_covid
   + facet_grid(. ~ borough))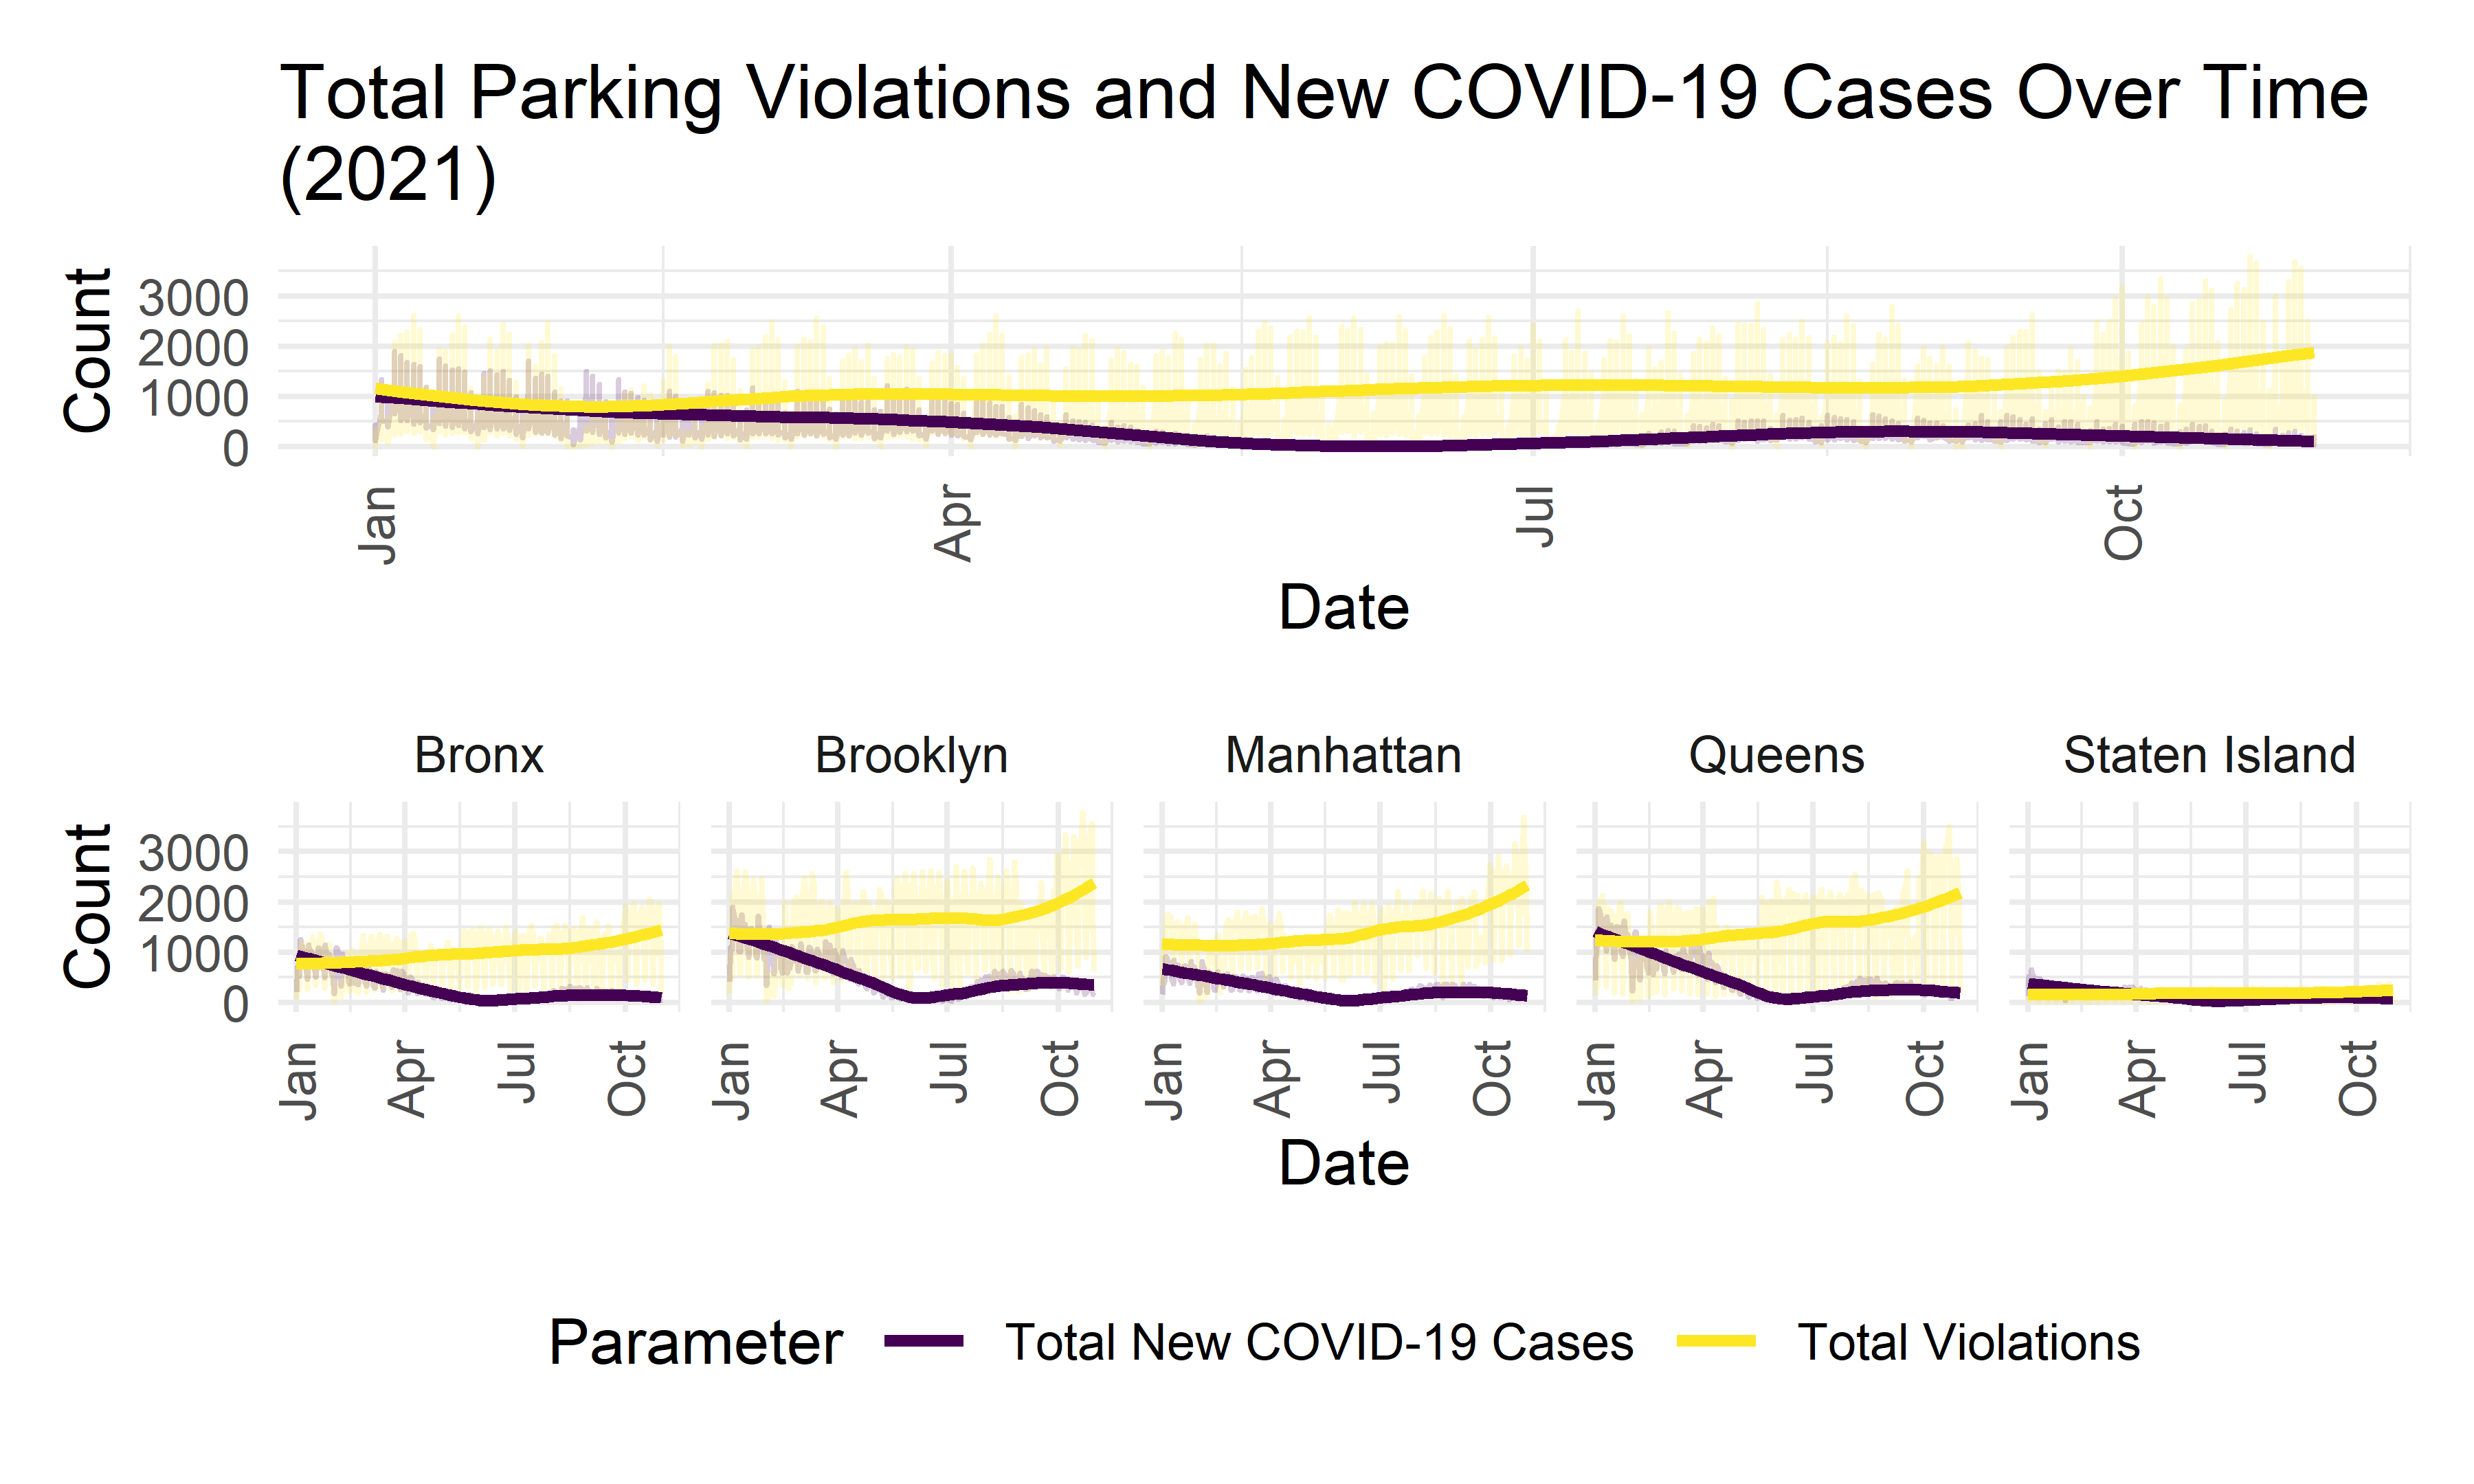
We will now perform a Granger-causality test to see if knowing the previous day’s number of COVID-19 cases is helpful in predicting the number of parking violations given out. We will perform this test at an \(\alpha = 0.05\) significance level.
grangertest(total_violations ~ new_cases, order = 1, data = violation_covid)## Granger causality test
##
## Model 1: total_violations ~ Lags(total_violations, 1:1) + Lags(new_cases, 1:1)
## Model 2: total_violations ~ Lags(total_violations, 1:1)
## Res.Df Df F Pr(>F)
## 1 1516
## 2 1517 -1 47.147 9.575e-12 ***
## ---
## Signif. codes: 0 '***' 0.001 '**' 0.01 '*' 0.05 '.' 0.1 ' ' 1As the test’s p-value is less than our predetermined significance level of 0.05, we reject the null hypothesis that a model only based on the total violations time series performs as well or out performs a model that is based on both the total violations time series and COVID-19 case count time series. Thus, there is at least some predictive causality between the daily count of COVID-19 cases and the total daily parking violations over the past year.