Fire Hydrants Violation
Fire Hydrants Violation
hydrant <-
  violation %>%
  filter(violation %in% c("FIRE HYDRANT"), !is.na(geo_nyc_address))
As our primary focus is on fire hydrant violations, we want to do more exploration particularly on fire hydrant violations. We want know how the number of fire hydrant violations distributed across each borough and over the time.
Hydrant Violations by Borough
hydrant %>%
  group_by(borough) %>%
  summarise(n_obs = n()) %>%
  mutate(
    borough = fct_reorder(borough, n_obs)
  ) %>%
  ggplot(aes(x = borough, y = n_obs, fill = borough)) + geom_bar(stat = "identity") +
  labs(
    title = "Frequency of Fire Hydrant Violations by Borough",
    x = "Borough",
    y = "Number of Violations"  ) +
  geom_text(aes(label = n_obs), position = position_dodge(width=0.9), vjust = -0.25) +
  theme(legend.position = "none")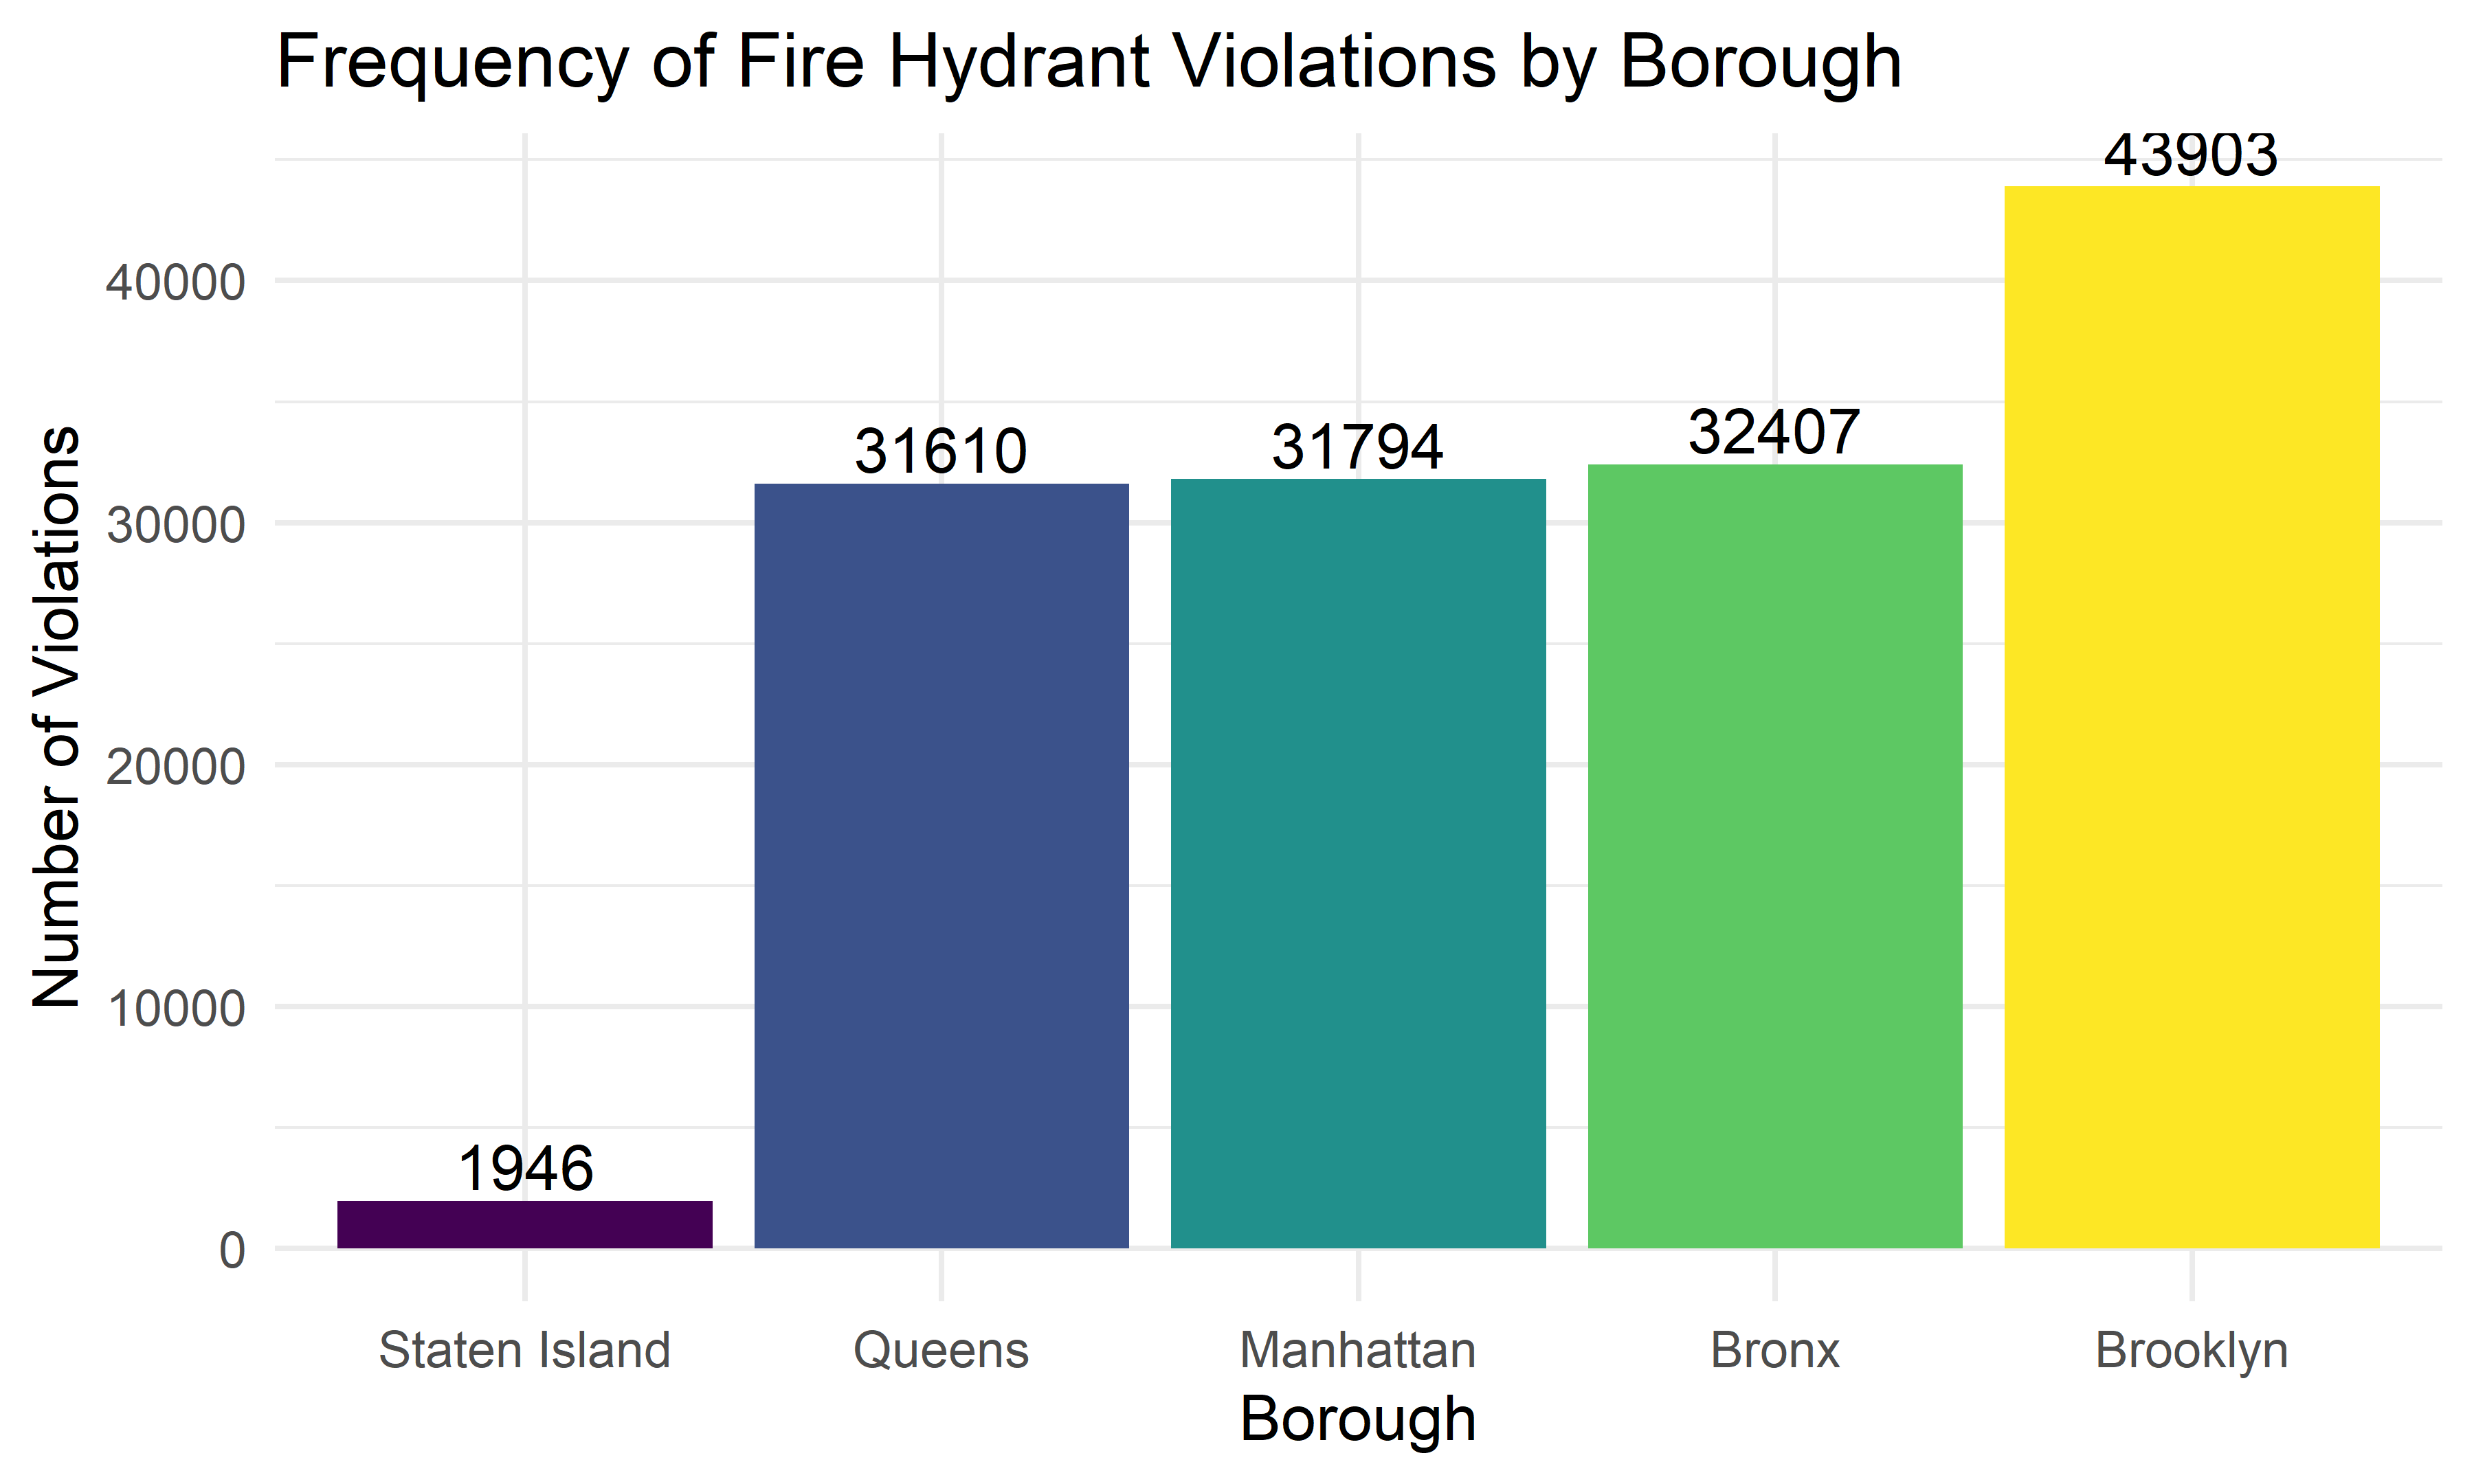
From the above bar charts, we can see that Staten Island has the fewest number of fire hydrant violations and Brooklyn has the highest number of fire hydrant violations, which is consistent with the total violations across boroughs we found before.
Hydrant Violations by Month
hydrant %>%
  mutate(month = month.name[as.numeric(month)]) %>%
  mutate(month = as.factor(month),
         month = fct_relevel(month, "January", "February", "March", "April", "May", "June", "July", "August", "September", "October")) %>%
  relocate(month) %>%
  group_by(borough, month) %>%
  summarize(n_obs = n()) %>%
  ggplot(aes(x = month, y = n_obs, group = 1, color = borough)) +
  geom_point() + geom_line() +
  theme(axis.text.x = element_text(angle = 60, hjust = 1, size = 5) ) +
  labs(title = "Fire Hydrant Violations by Month and Borough",
       color = "Borough",
       y = "Number of Violations",
       x = "Month"
       ) + facet_wrap(~ borough, nrow = 1)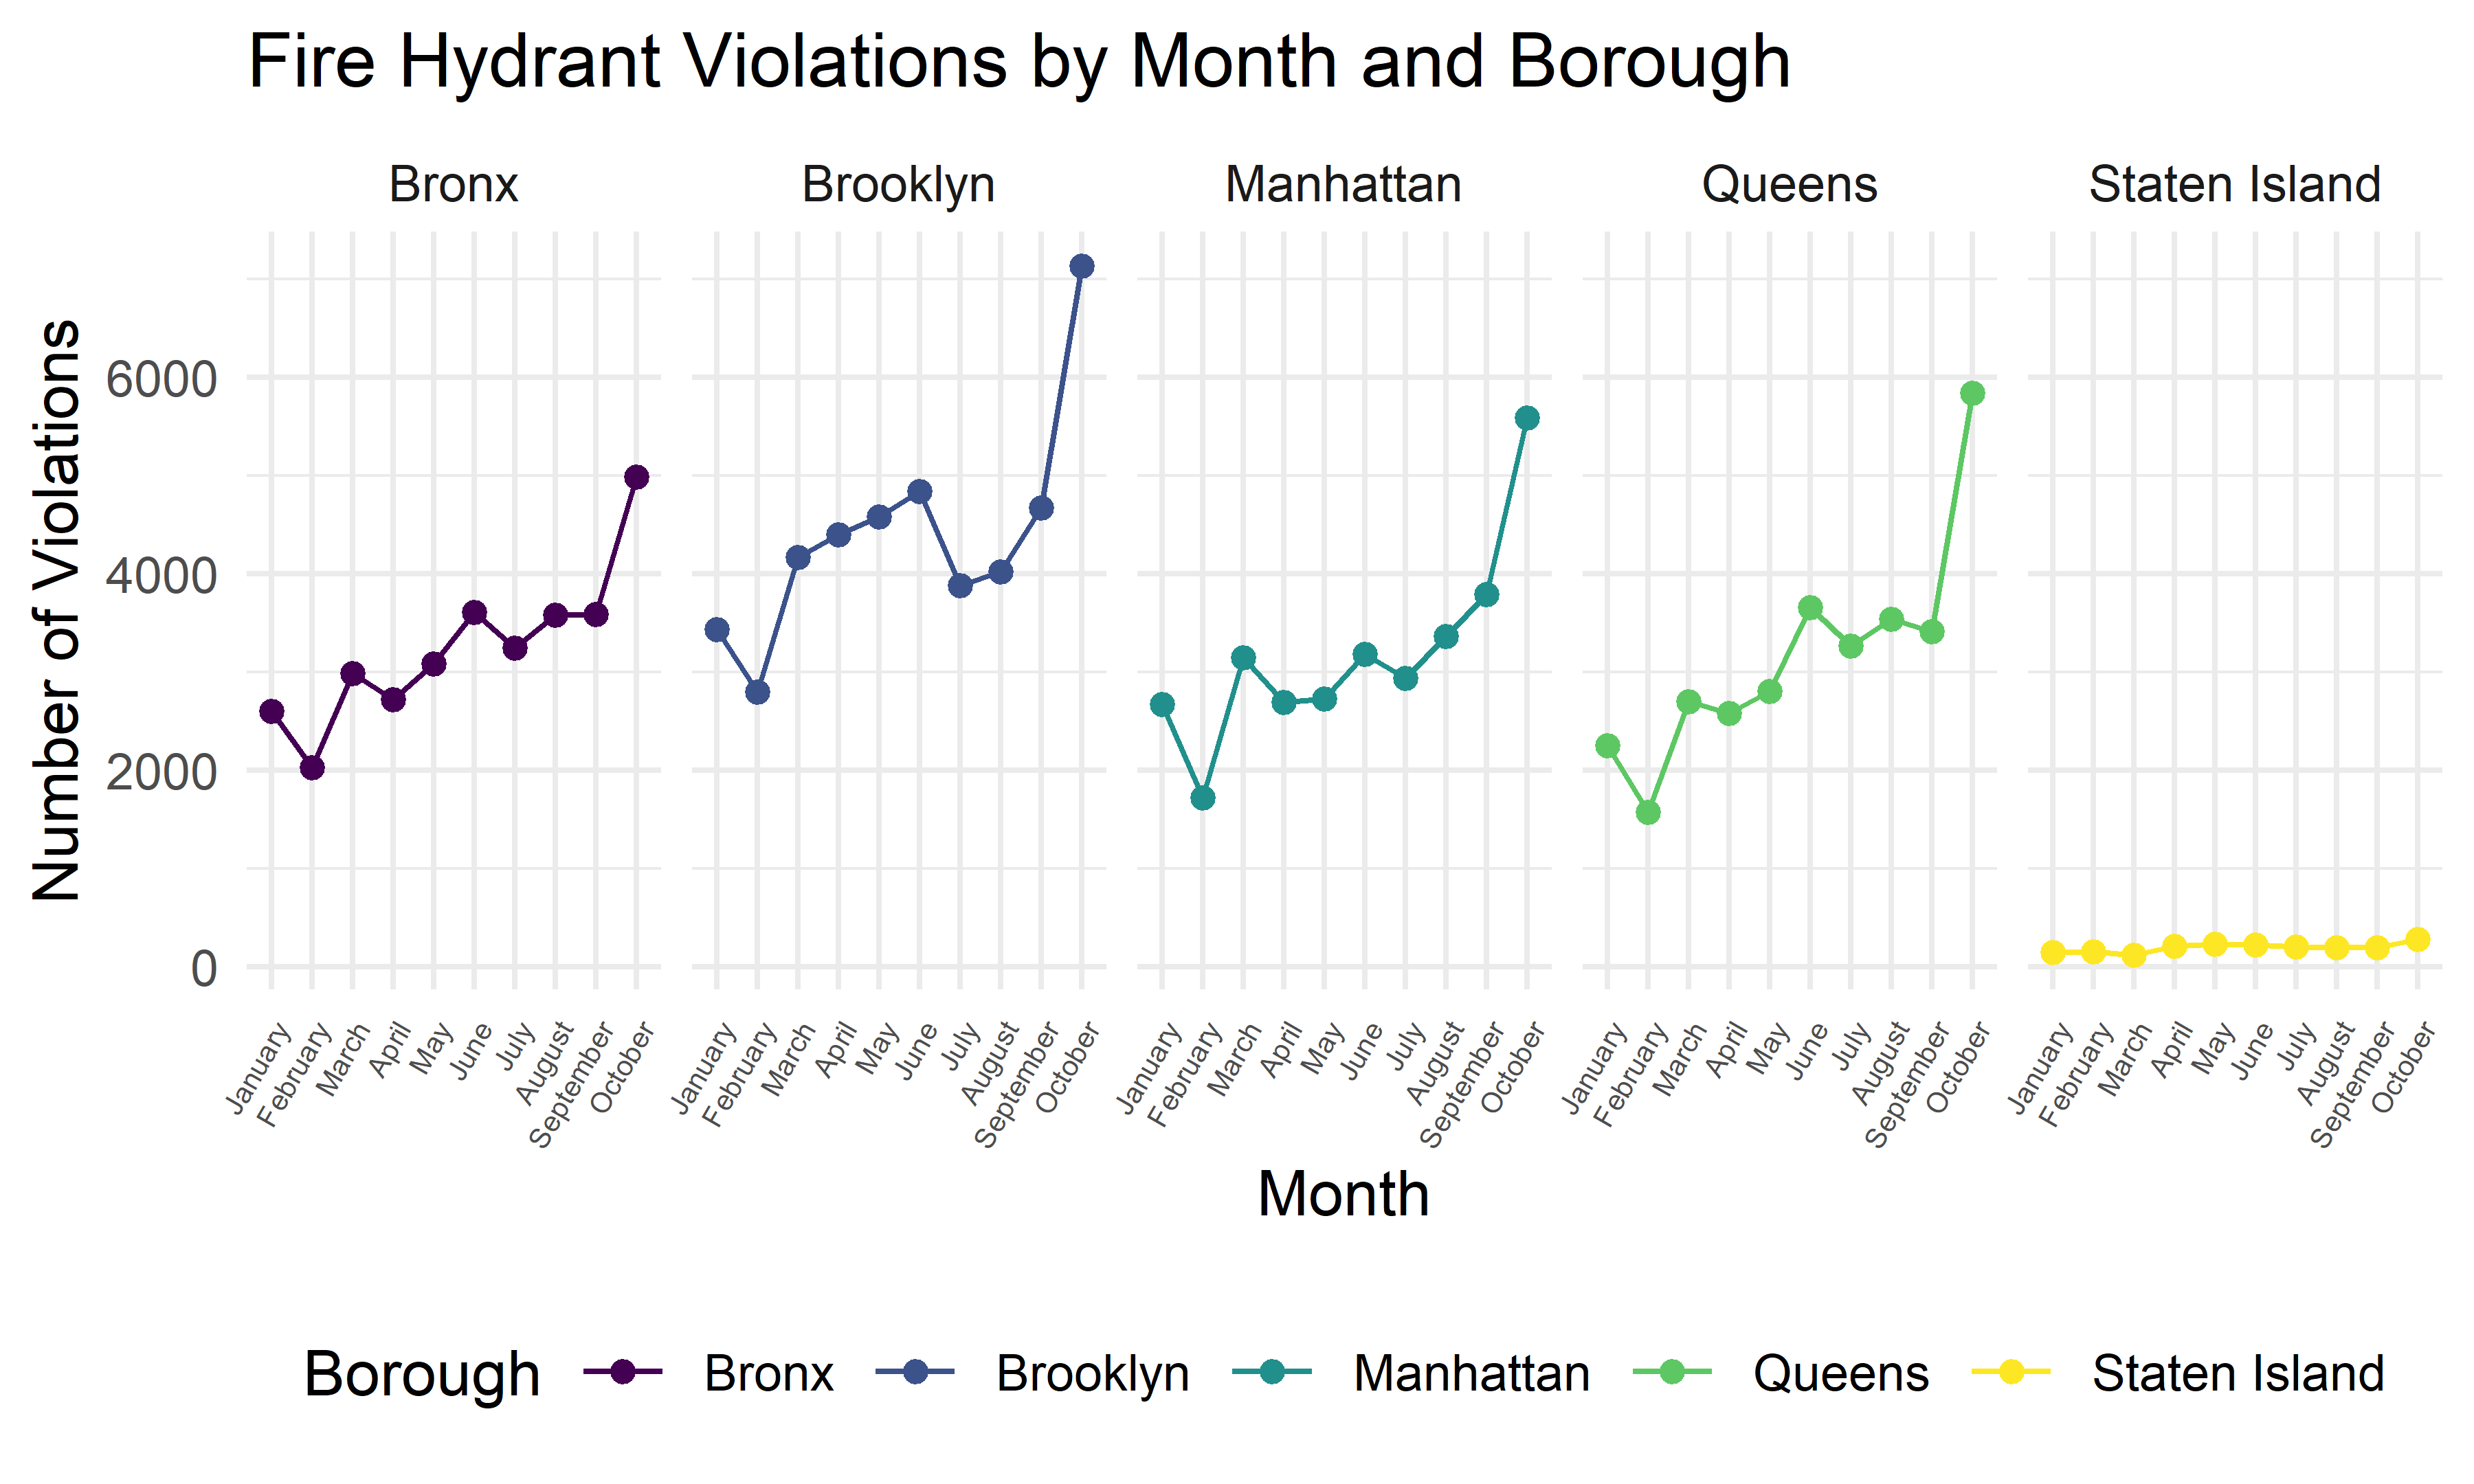
This plot shows the number of fire hydrant violations within each month for different boroughs. We can see that all boroughs have a similar pattern, the total violation counts in February is lower, and the total violation counts in October is higher comparing to other months. It’s also quite consistent with the pattern we found for the total number of violations above.