Frequency
Violation Frequency
We first want to get a feel for the distribution of violations across the five boroughs. We will construct a bar chart tabulating the number of parking violations incurred in each of the five boroughs.
Distribution of Parking Violation
violation1 %>%
  count(borough) %>%
  mutate(
    borough = fct_reorder(borough, n)
    ) %>%
  ggplot(aes(x = borough, y = n, fill = borough)) +
  geom_bar(stat = "identity") +
  labs(
    title = "Frequency of Tickets by Borough",
    x = "Borough",
    y = "Number of Tickets",
    fill = "Borough") +
  theme(
    axis.text.x = element_blank()
  )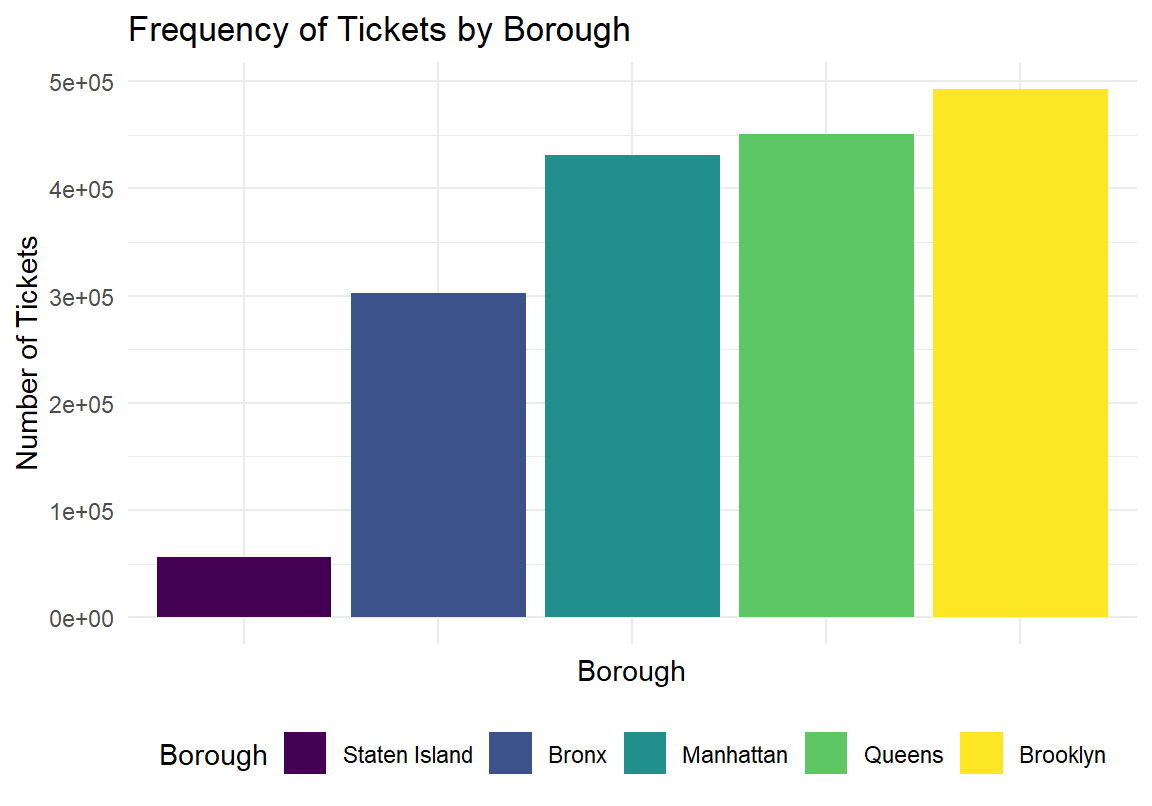
Brooklyn has the greatest number of tickets among five boroughs. Staten Island has the lowest number of tickets in 2021.
The bar graph further break down the number of tickets in five borough from January to October in 2021. There is sharp increasing of number of tickets in October. The distribution of number of tickets are similar from January to October across Borough. Brooklyn has the highest number of tickets, while State Island has the least number of tickets. There is large increase in number of tickets in October in all boroughs except Staten Island.
violation1 %>%
  group_by(borough) %>%
  count(month) %>%
  mutate(month = month.abb[as.numeric(month)],
         month = fct_relevel(month, c("Jan", "Feb", "Mar", "Apr","May","Jun", "Jul", "Aug", "Sep", "Oct"))) %>%
  ggplot(aes(x = month, y = n, fill = borough)) +
  geom_bar(stat = "identity",
           position = "dodge") +
  labs(
    title = "Frequency of Tickets in Boroughs",
    x = "Month",
    y = "Number of Tickets in Each Month",
    fill = "Borough")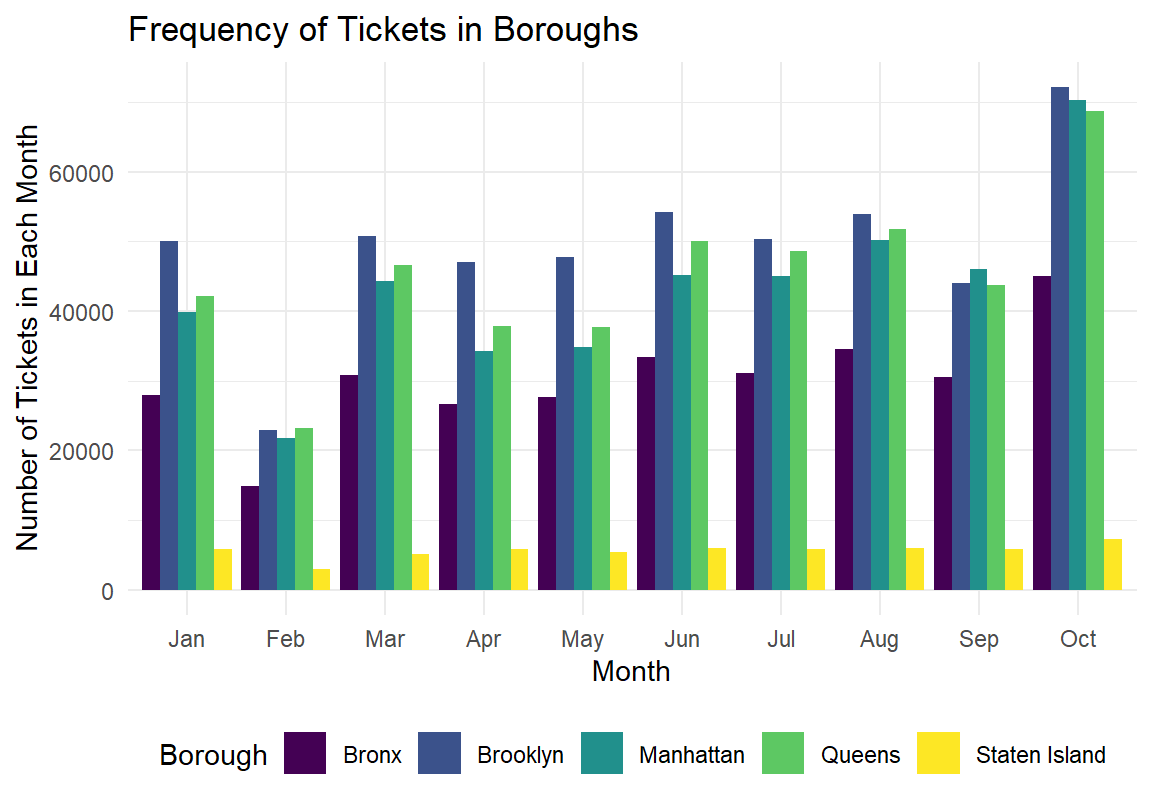
Top 10 Violations in NYC in 2021
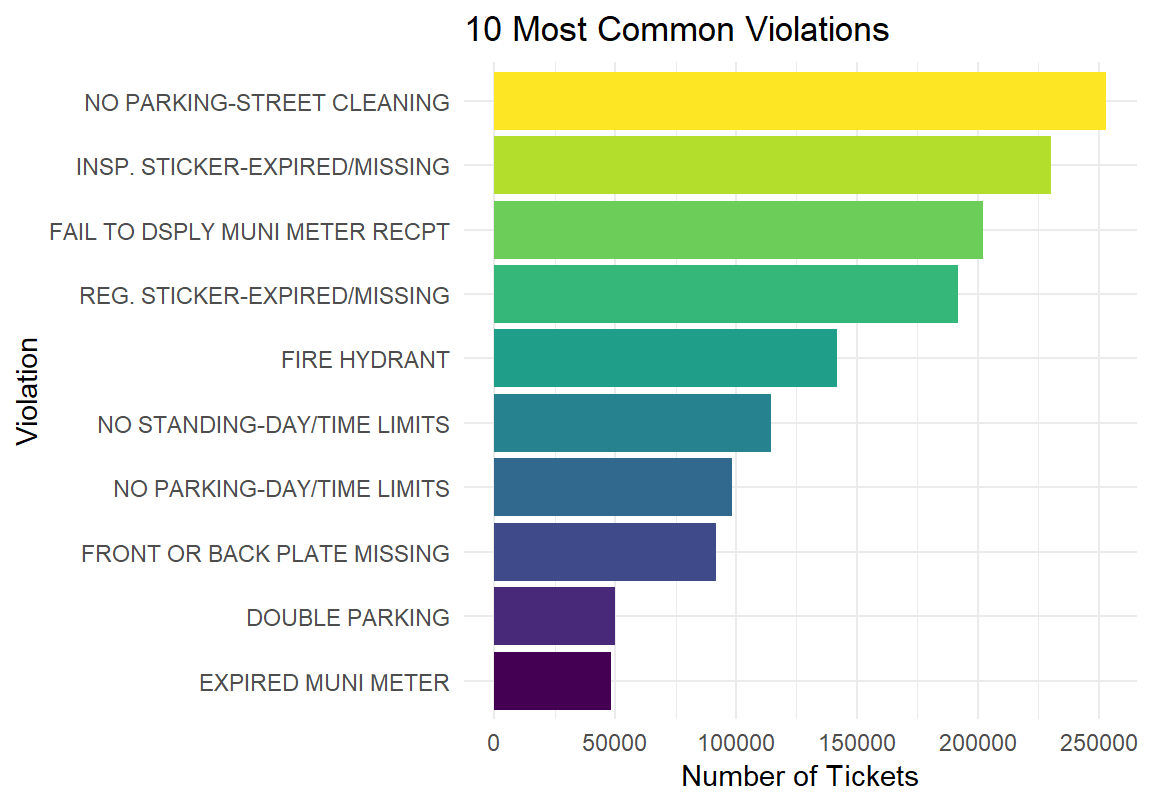
We want to know the most common ten violation types based on the total frequency in NYC in 2021.
total_violation = violation1 %>%
  count(violation) %>%
  mutate(
    violation = fct_reorder(violation, n),
    ranking = min_rank(desc(n))
  ) %>%
  filter(ranking <= 10) %>%
  arrange(n)

total_violation %>%
  ggplot(aes(x = violation, y = n, fill = violation)) +
  geom_bar(stat = "identity") +
  labs(title = "10 Most Common Violations",
       x = "Violation",
       y = "Number of Tickets",
       fill = "Violation") + coord_flip() +
  theme(legend.position = "none"
) 
Top 5 Violation Types Across Boroughs
We want to find the top five common violation types in each borough, and see whether there exists difference among boroughs. We found that the most common 5 reasons of getting a violation tickets in NYC among all five boroughs are: 1) No parking-street cleaning, 2) Failure to display a muni-meter receipt, 3) Inspection sticker-expired/missing, 4) Registration sticker-expired /missing, and 5) Fire hydrant.
## top 5 reasons of violation tickets
violation_type = violation1 %>%
  group_by(borough) %>%
  count(violation) %>%
  mutate(
    violation = fct_reorder(violation, n),
    index = min_rank(desc(n))) %>%
  filter(index <= 5)  %>%
  arrange(index)
Bronx
bronx_vio_type =
  violation_type %>%
  filter(borough == "Bronx") %>%
  ggplot(aes(x = index, y = n, fill = violation)) +
  geom_bar(stat = "identity") +
  labs(
    title = "Top 5 Parking Violation Types in Bronx (2021)",
    x = "Violation Type",
    y = "Number of tickets") +
  theme(
    axis.text.x = element_blank(),
    legend.text = element_text(size = 8),
    legend.key.size = unit(.5,"line"),
    legend.position = "right")
bronx_vio_type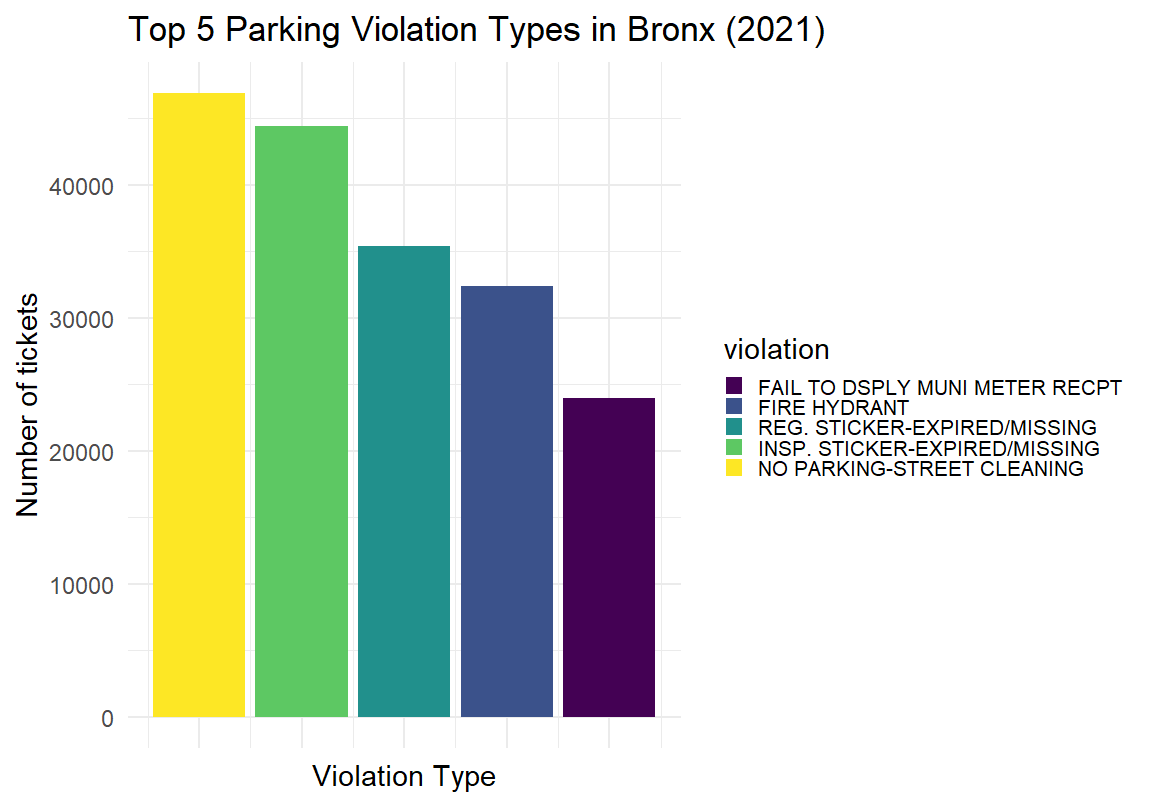
Brooklyn
brooklyn_vio_type =
  violation_type %>%
  filter(borough == "Brooklyn") %>%
  ggplot(aes(x = index, y = n, fill = violation)) +
  geom_bar(stat = "identity") +
  labs(
    title = "Top 5 Parking Violation Types in Brooklyn (2021)",
    x = "Violation Type",
    y = "Number of tickets") +
  theme(
    axis.text.x = element_blank(),
    legend.text = element_text(size = 8),
    legend.key.size = unit(.5,"line"),
    legend.position = "right")

brooklyn_vio_type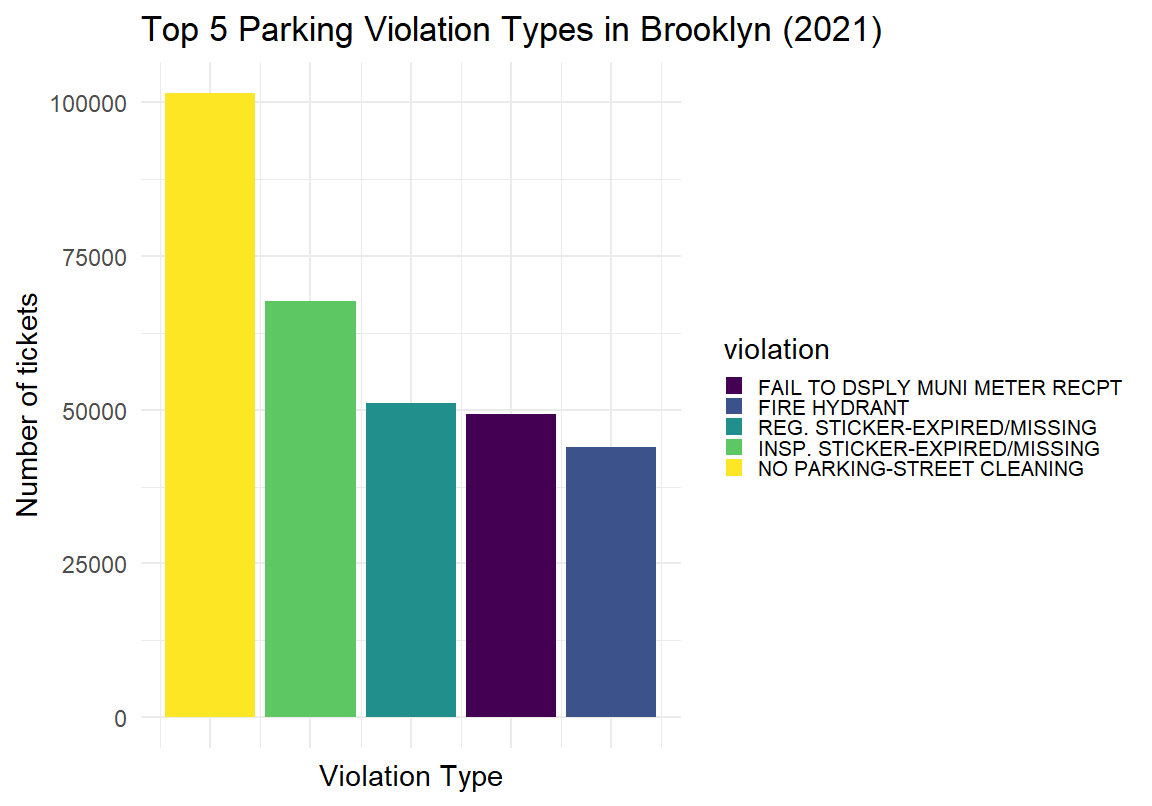
Manhattan
manhattan_vio_type =
  violation_type %>%
  filter(borough == "Manhattan") %>%
  ggplot(aes(x = index, y = n, fill = violation)) +
  geom_bar(stat = "identity") +
  labs(
    title = "Top 5 Parking Violation Types in Manhattan (2021)",
    x = "Violation Type",
    y = "Number of tickets") +
 theme(
    axis.text.x = element_blank(),
    legend.text = element_text(size = 8),
    legend.key.size = unit(.5,"line"),
    legend.position = "right")

manhattan_vio_type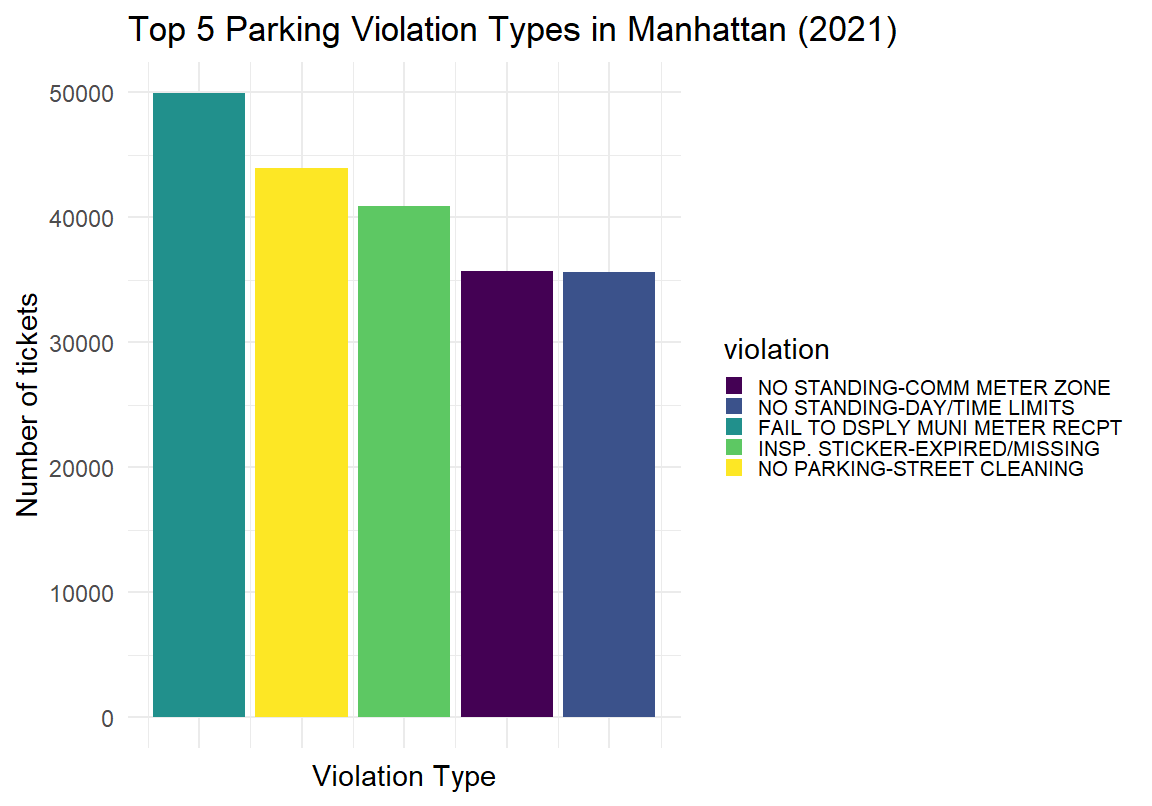
Queens
queens_vio_type =
  violation_type %>%
  filter(borough == "Queens") %>%
  ggplot(aes(x = index, y = n, fill = violation)) +
  geom_bar(stat = "identity") +
  labs(
    title = "Top 5 Parking Violation Types in Queens (2021)",
    x = "Violation Type",
    y = "Number of tickets") +
  theme(
    axis.text.x = element_blank(),
    legend.text = element_text(size = 8),
    legend.key.size = unit(.5,"line"),
    legend.position = "right")

queens_vio_type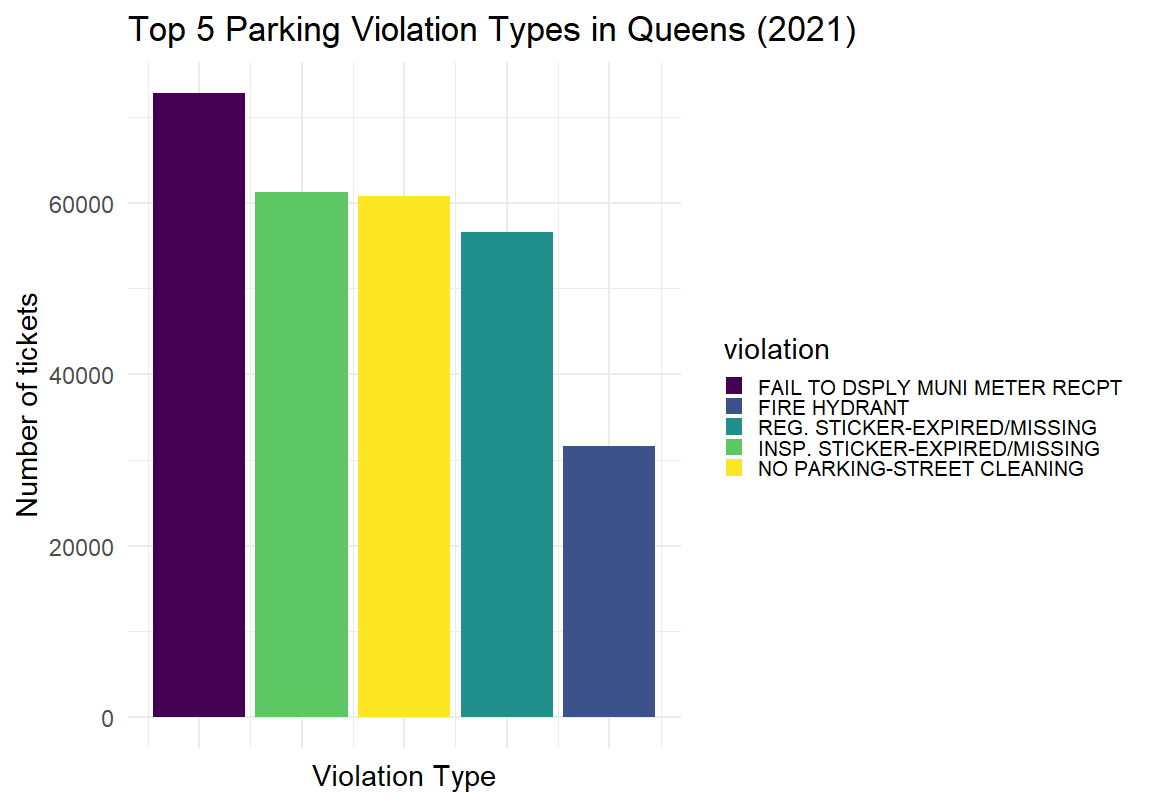
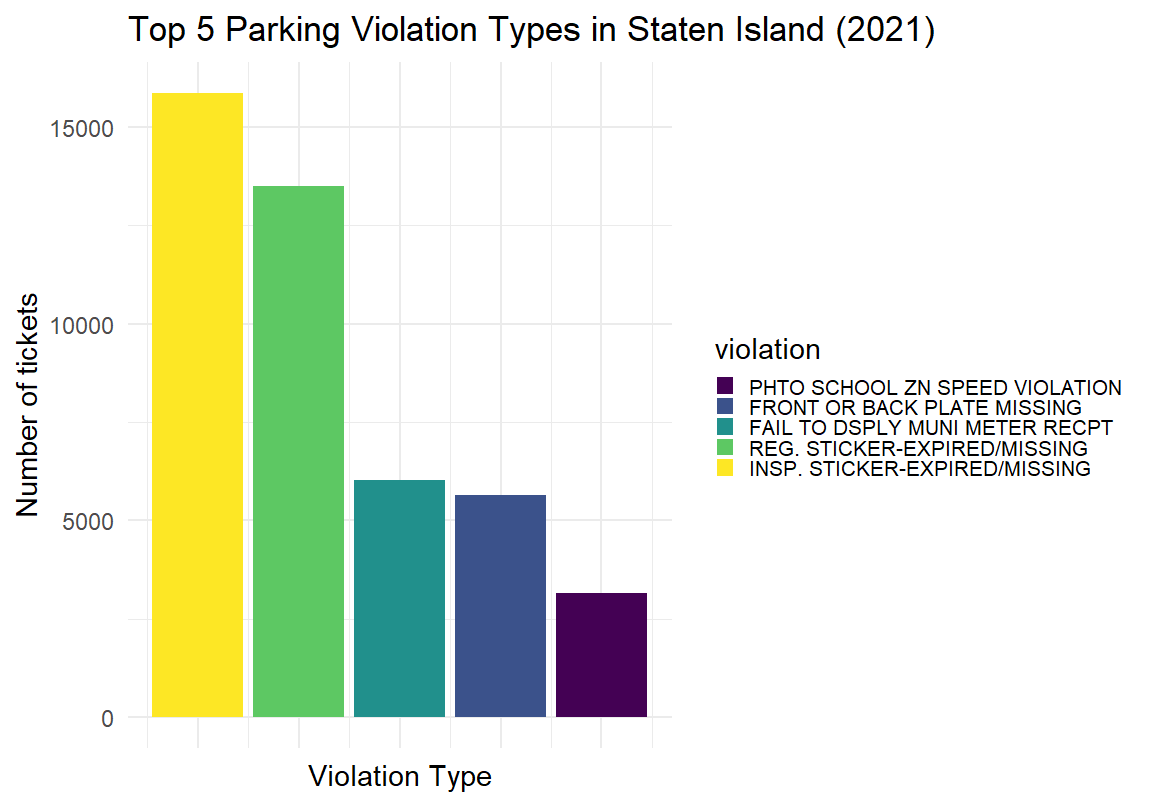
Staten Island
si_vio_type =
  violation_type %>%
  filter(borough == "Staten Island") %>%
  ggplot(aes(x = index, y = n, fill = violation)) +
  geom_bar(stat = "identity") +
  labs(
    title = "Top 5 Parking Violation Types in Staten Island (2021)",
    x = "Violation Type",
    y = "Number of tickets") +
  theme(
    axis.text.x = element_blank(),
    legend.text = element_text(size = 8),
    legend.key.size = unit(.5,"line"),
    legend.position = "right")

si_vio_type